For the better part of two years, the bulls have been firmly in control on Wall Street. A resilient U.S. economy, coupled with excitement surrounding the rise of artificial intelligence (AI), have helped lift the ageless Dow Jones Industrial Average (DJINDICES: ^DJI), benchmark S&P 500 (SNPINDEX: ^GSPC), and growth-focused Nasdaq Composite (NASDAQINDEX: ^IXIC) to multiple record-closing highs in 2024.
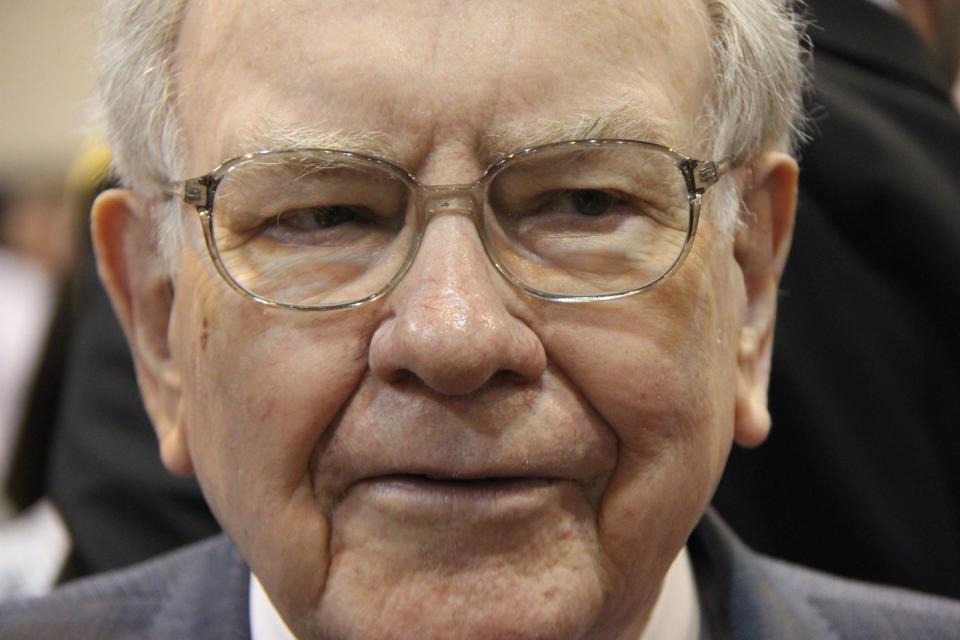
However, optimism isn’t universal when it comes to investing. Some of the most prominent and widely followed billionaire money managers, including Berkshire Hathaway‘s (NYSE: BRK.A)(NYSE: BRK.B) Warren Buffett, Appaloosa’s David Tepper, and Fundsmith’s Terry Smith, have been sending an ominous warning to Wall Street with their trading activity.

Some of Wall Street’s top investors are retreating to the sidelines
Although no money manager is a carbon copy of another, Buffett, Tepper, and Smith are cut from similar cloths. While they may have different areas of expertise or dabble in investment areas the other two may not — e.g., David Tepper tends to be a bit of a contrarian and isn’t afraid to invest in distressed assets, including debt — all three tend to be patient investors who focus on locating undervalued/underappreciated companies that can be held for long periods in their respective funds. It’s a really simple formula that’s worked well for all three billionaire investors.
When Form 13Fs are filed with the Securities and Exchange Commission each quarter, professional and everyday investors flock to these reports to see which stocks, industries, sectors, and trends have been piquing the interest of Wall Street’s brightest investment minds. However, the latest round of 13Fs had a surprise for investors who closely follow the trading activity of Buffett, Tepper, and Smith.
The June-ended quarter marked the seventh consecutive quarter that Warren Buffett was a net seller of stocks. Jettisoning more than 389 million shares of top holding Apple during the second quarter, and north of 500 million shares, in aggregate, since Oct. 1, 2023, has led to a cumulative $131.6 billion in net stock sales since the start of October 2022.
Despite advocating that investors not bet against America, and emphasizing the value of long-term investing, Buffett’s short-term actions haven’t lined up with his long-term ethos.
But he’s not alone.
David Tepper’s Appaloosa closed out June with a 37-security investment portfolio worth around $6.2 billion. During the second quarter, Tepper and his team added to nine of these positions and reduced or completely sold his fund’s stake in 28 others, including Amazon, Microsoft, Meta Platforms, and Nvidia. Tepper dumped 3.73 million shares of Nvidia, equating to more than 84% of Appaloosa’s prior position.
U.K. stock picker extraordinaire Terry Smith ended June with a 40-stock portfolio worth roughly $24.5 billion. He added to his stakes in just three of these 40 stocks — Fortinet, Texas Instruments, and Oddity Tech — while reducing his fund’s position in the other 37.
These patient and historically optimistic investors are sending a message that’s undeniably clear: Value is hard to come by right now on Wall Street.

Stocks are historically pricey — and that’s a problem
Although “value” is a completely subjective term, one valuation tool points to stocks being at one of their priciest levels in history, dating back to the 1870s. I’m talking about the S&P 500’s Shiller price-to-earnings (P/E) ratio, which is also known as the cyclically adjusted price-to-earnings ratio (CAPE ratio).
Most investors are probably familiar with the traditional P/E ratio, which divides a company’s share price into its trailing-12-month earnings per share (EPS). While the P/E ratio tends to work pretty well for mature businesses, it falls short for growth stocks that reinvest a lot of their cash flow. It can also be adversely impacted by one-off events, such as the COVID-19 lockdowns.
The Shiller P/E ratio is based on average inflation-adjusted EPS over the last 10 years. Taking a decade’s worth of earnings history into account means short-term events don’t adversely affect this valuation model.
As of the closing bell on Sept. 16, the S&P 500’s Shiller P/E stood at 36.27, which is just below its 2024 high of roughly 37, and more than double the 153-year average of 17.16, when back-tested to 1871.
To be fair, the Shiller P/E has spent much of the last 30 years above its historic average due to two factors:
-
The internet democratized the access to information, which gave everyday investors more confidence to take risks.
-
Interest rates spent more than a decade at or near historic lows, which encouraged investors to pile into higher-multiple growth stocks that can benefit from low borrowing costs.
But when examined as a whole, there are only two other periods throughout history where the S&P 500’s Shiller P/E supported a higher level during a bull market. It peaked at 44.19 in December 1999, just prior to the dot-com bubble bursting, and briefly topped 40 during the first week of January 2022.
Following the dot-com bubble peak, the S&P 500 shed just shy of half of its value, while the Nasdaq Composite lost more than three-quarters before finding its footing. Meanwhile, the 2022 bear market saw the Dow Jones, S&P 500, and Nasdaq Composite all lose at least 20% of their value.
In 153 years, there have only been six occasions where the S&P 500’s Shiller P/E has surpassed 30 during a bull market, including the present. Following all five previous instances, the minimum downside in the S&P 500 has been 20%, with the Dow Jones Industrial Average losing as much as 89% during the Great Depression.
The point is that extended stock valuations can only be sustained for so long. Even though Warren Buffett would never bet against America, and Terry Smith is always on the lookout for undervalued assets, neither billionaire money manager feels compelled to put their capital to work. In fact, Berkshire Hathaway was sitting on a record $276.9 billion in cash at the end of June, and Buffett still isn’t a buyer of stocks… other than shares of his own company.
In short, some of Wall Street’s most-successful long-term, value-seeking investors want little to do with the stock market right now, and it’s a very clear warning that investors should be paying attention to.
Where to invest $1,000 right now
When our analyst team has a stock tip, it can pay to listen. After all, Stock Advisor’s total average return is 762% — a market-crushing outperformance compared to 167% for the S&P 500.*
They just revealed what they believe are the 10 best stocks for investors to buy right now…
*Stock Advisor returns as of September 16, 2024
John Mackey, former CEO of Whole Foods Market, an Amazon subsidiary, is a member of The Motley Fool’s board of directors. Randi Zuckerberg, a former director of market development and spokeswoman for Facebook and sister to Meta Platforms CEO Mark Zuckerberg, is a member of The Motley Fool’s board of directors. Sean Williams has positions in Amazon and Meta Platforms. The Motley Fool has positions in and recommends Amazon, Apple, Berkshire Hathaway, Fortinet, Meta Platforms, Microsoft, Nvidia, and Texas Instruments. The Motley Fool recommends the following options: long January 2026 $395 calls on Microsoft and short January 2026 $405 calls on Microsoft. The Motley Fool has a disclosure policy.
Billionaires Warren Buffett, David Tepper, and Terry Smith Are Sending a Very Clear Warning to Wall Street — Are You Paying Attention? was originally published by The Motley Fool
Source: finance.yahoo.com

