The most dominant stock in the artificial intelligence (AI) space, Nvidia (NVDA), is about to become more affordable. At the end of the week, NVDA will undergo a 10-for-1 stock split. Therefore, instead of having to shell out over $1,000 to own a share, you’ll be able to buy a share for close to $100.
Theoretically, a stock split has no effect on the value of a company because its lower price is offset by an increase in shares. But it will make the stock – not to mention its options – more affordable for smaller accounts. So, should you add NVDA to your portfolio? This week, I’m looking at how stocks performed in the past after prices dropped following a stock split.
Stock Returns After Splits
Looking at current optionable stocks and going back to 2010, I have data on about 240 splits. The table below summarizes how stocks performed following those splits. The second table is for comparison, and shows what returns would have looked like if instead of buying stocks, you bought the broad-market S&P 500 Index (SPX).
Based on those numbers, I would say stock splits are not a reason to buy. Stocks that split performed similarly to the SPX. In the two weeks immediately following a split, the stocks averaged a gain of 0.44%, with just under half beating the index. The six-month average return slightly outperforms the SPX (6.6% to 5.4%), with again just under half beating the index. Investing in the general market, however, yields a lot less volatility.

Breaking Down Splits for NVDA
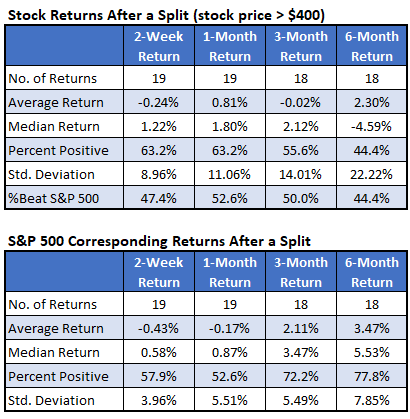
Nvidia shares rose considerably in price over the last two years, and now sit at over $1,000 per share. The tables below look at splits where the stock was above $400 before the split.
The returns following these 19 stock splits show slight underperformance. Looking at three months after the split, the stock is essentially at breakeven, while the SPX showed a return of 2.11%. Meanwhile, six months after the splits, stocks averaged a 2.3% gain vs. 3.47% for the index, while only 44% of the returns beat the index over the next six months.

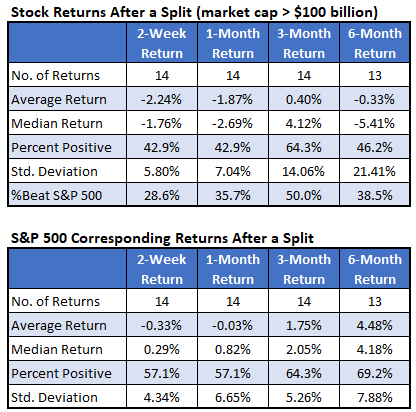
Nvidia is one of just a handful of companies that have a market cap above $2 trillion. To put this into perspective, there have only been14 splits where the company had a market cap above $100 billion.
Huge companies significantly underperformed following stock splits. In the short term, the stocks averaged a loss of more than 2% over the next two weeks, with not even 30% beating the SPX. The six-month returns also underperformed, averaging a slight loss of 0.3%, with just 38.5% of the returns beating the SPX.

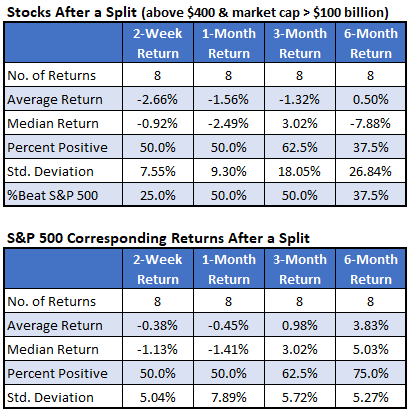
Finally, let’s take a look at expensive stocks with huge market caps that split. As you would expect after looking at the figures above, these stocks tended to underperform the broader market. They averaged a loss of 2.66% over the first two weeks, and then rose from there to get just above breakeven after six months.
This means that buying the stocks that split yielded a 0.5% return over the next six months, with 37.5% being positive, and the same amount beating the SPX. If instead you just bought the SPX, the average return was 3.8%, with six of eight being positive.

As a bonus, here is a list of those eight companies that were trading above $400 with a market cap above $100 billion at the time of their splits. The analysis above isn’t looking good for NVDA, but on the bright side, the security has been here before. NVDA met the criteria at its last stock split in mid-2021, and went on to gain almost 40% over the next six months. It’s now up over 500% since that split.

Source: finance.yahoo.com
